Blog • 4 mins read
Operational Dashboard: Real-Time Visibility Into Every Work Order and Field Ticket

FieldEquip
Last Updated: July 17, 2026

A single view of what's happening across your operation, updated the moment it changes — no status calls required.
Why We Built This
In field-heavy businesses — industrial services, oil and gas field services, equipment rental and railcar repair services — the biggest source of delay usually isn't the work itself. It's the gap between when something happens in the field and when the people managing the business find out about it.
A work order sits stalled at a job site. A field ticket sits waiting on approval. By the time someone calls dispatch or pulls yesterday's numbers to check, the delay has already cost time, and sometimes trust with a customer.
The Operational Dashboard closes that gap. It brings work order status and field ticket activity into one live view, so your team can see and act on what's happening now, instead of reconstructing it after the fact.
Now available as an upgrade to yourFieldEquip plan. Talk to your account manager to add it to your account.
What the Operational Dashboard Shows You
The dashboard is organized around the questions operations leaders ask every day: what's moving, what's stuck, and what needs attention first.

- Filters (Date, Business Unit, Customer): Lets you narrow the dashboard by time, division, or account, so different stakeholders can each get answers relevant to their own scope from one screen.
- KPI Summary Cards: Surfaces open work orders, first-time fix rate, completion rate, and unassigned orders at a glance, flagging service quality and capacity gaps instantly.
- Work Orders by Business Unit (Pie Chart): Shows volume share per business unit, helping spot which unit is driving the most workload and whether staffing matches demand.
- Business Unit vs. Status (Stacked Bar): Breaks down order status by business unit, revealing exactly where work is stuck so bottlenecks become specific and actionable, not vague.
- Work Orders by Work Type (Bar Chart): Ranks service categories by volume, helping prioritize crew training, parts stocking, and capacity planning around highest-demand work types.
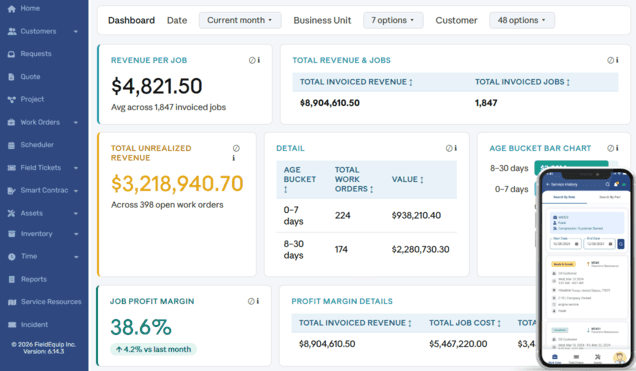
- Detail Table (Age Bucket): Groups aging work orders with count and dollar value, tying delayed work directly to revenue at risk, not just count of backlog.
- Age Bucket Bar Chart: Visualizes revenue at risk from aging work orders as a quick comparison, ideal for a fast executive scan or leadership meeting.
- Top Locations by Work Orders: Ranks job sites by volume, helping decide where to add crews, stage equipment, or investigate recurring site-level issues.
- Top Customers by Work Orders: Ranks customers by volume, highlighting top accounts for prioritization and spotting spikes that signal growth or early warning.
- Work Order Report (Searchable Table): Gives a full, filterable list of individual orders so dispatch can act directly on specific ones, not just summaries.
Who Can See It — And How Access Is Controlled
Not everyone needs to see the same thing. The Operational Dashboard can be shared by role or by team, so each person sees the view that's relevant to their job — nothing more, nothing less.
| Role | What They Typically See |
|---|---|
| Dispatcher | Live work order status for their assigned crews and region |
| Crew Lead | Work orders and field tickets tied to their own jobs |
| Regional Operations Manager | Aggregated status across all crews and job sites in their region |
| Executive / Leadership | Company-wide operational summary across all regions |
Access is configured in your account's user and role settings, so it's your team's structure — not ours — that determines who sees what.
Tracking Who's Using It
Every Operational Dashboard now includes an activity log. You can see who has viewed it and how often, which makes it easy to confirm the dashboard is actually part of your team's daily routine — not just a feature that's turned on and forgotten.
Getting Started
The Operational Dashboard is available now as an upgrade to your FieldEquip plan. If you're already a customer, your account manager can walk you through what's included and get it added to your account. If you're evaluating FieldEquip, our team can show you how it works as part of your package.
- Current customers: Contact your account manager to add the Operational Dashboard to your plan.
- Prospective customers: Book a demo with our team to see it on a sample of your own operational data.
Frequently Asked Questions
No. The Operational Dashboard is additive — it doesn't remove or change any existing views in your account.
Yes. Access is managed through your existing user and role settings, so you decide which teams or individuals see the dashboard.
Reach out to your FieldEquip account manager or our support team — we read every piece of feedback on new releases.
A Clearer Way to Run Field
Service Operations
Field service challenges are not just operational. They directly affect cash flow, billing accuracy, and scalability.
Schedule a Demo